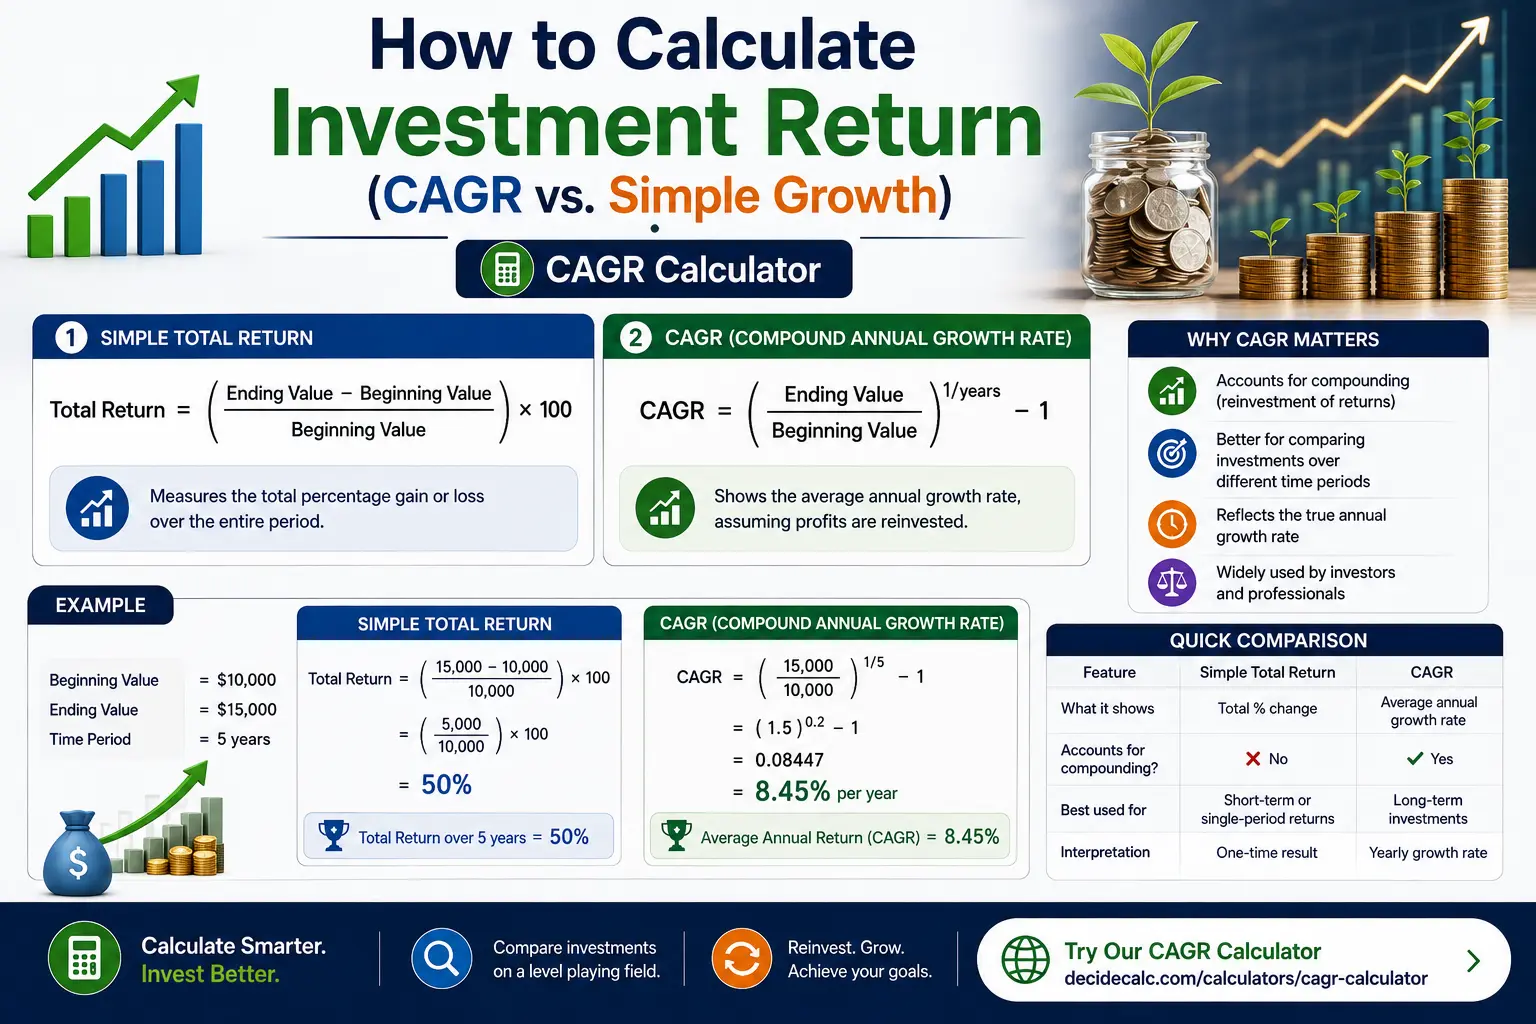
You invested $10,000 five years ago and it's now worth $16,105. What was your return? The simple answer is "61%," but that doesn't tell the full story. A more useful number is the 7% per year (CAGR) — the annualized rate that lets you compare this investment against any other, regardless of how long it was held.
Two ways to measure return
1. Simple total return
Example: ($16,105 − $10,000) / $10,000 = 61.05%
Simple total return is useful for a single comparison, but it ignores time. A 61% return over 5 years is very different from a 61% return over 25 years.
2. CAGR (Compound Annual Growth Rate)
Example: (16,105 / 10,000)^(1/5) − 1 = 1.6105^0.2 − 1 = 10.0% per year
Wait — 10%, not 7%? Yes. The example above was designed for 10% CAGR. CAGR is always higher than the simple average of annual returns if returns varied. It's the geometrically correct average.
Worked example: $10,000 at different rates
| Rate | 5 years | 10 years | 20 years | 30 years |
|---|---|---|---|---|
| 5% CAGR | $12,763 | $16,289 | $26,533 | $43,219 |
| 7% CAGR | $14,026 | $19,672 | $38,697 | $76,123 |
| 10% CAGR | $16,105 | $25,937 | $67,275 | $174,494 |
| 12% CAGR | $17,623 | $31,058 | $96,463 | $299,599 |
At 7% CAGR for 20 years, $10,000 grows to $38,697. At 5% for 20 years it reaches $26,533 — a $12,164 difference purely from 2 extra percentage points of annual return.
Does 10 years at 7% beat 20 years at 5%?
For a lump sum, no — 20 years at 5% produces $26,533 vs $19,672 for 10 years at 7%. But if you compare both investments over 20 years, the 7% investment grows to $38,697, far outpacing the 5% result of $26,533. Higher rate wins if the time period is equal. Time wins if the rate is equal.
How fees affect your actual return
| Gross return | Annual fee | Net CAGR | $10K after 20 years | Lost to fees |
|---|---|---|---|---|
| 7% | 0.04% (index fund) | 6.96% | $38,467 | $230 |
| 7% | 0.75% (active fund) | 6.25% | $33,863 | $4,834 |
| 7% | 1.50% (high-cost fund) | 5.50% | $29,178 | $9,519 |
A seemingly small 1.5% annual fee costs you nearly $9,500 on a $10,000 investment over 20 years — almost equal to the original principal. This is why expense ratios matter enormously in long-term investing.
Calculating return when you made contributions
If you invested $10,000 upfront and added $200/month for 10 years, your total invested capital is $10,000 + ($200 × 120) = $34,000. If the portfolio is worth $53,000, is that a good return?
Simple total return: ($53,000 − $34,000) / $34,000 = 56%. But this ignores that the last month's $200 had only 1 month to grow while the first $10,000 had 10 years. The correct tool here is XIRR (in Excel or Google Sheets), which calculates an internal rate of return accounting for the timing of each cash flow. For regular monthly contributions at market returns of ~7%, a $53,000 balance on $34,000 invested over 10 years implies roughly a 6.5–7% annualized return.
Quick reference: CAGR vs simple return
| What you want to know | Use this |
|---|---|
| Total profit or loss on one investment | Simple total return |
| Annualized return to compare investments | CAGR |
| Return on a portfolio with contributions | IRR / XIRR |
| Year-by-year performance (volatile returns) | Time-weighted return (TWR) |
Frequently asked questions
What is the formula for calculating investment return?
Simple total return = (Ending Value − Beginning Value) / Beginning Value × 100. For annualized return (CAGR): CAGR = (Ending Value / Beginning Value)^(1/years) − 1.
What is CAGR and why does it matter?
CAGR is the steady annual rate at which an investment grew from start to finish, assuming compounding. It smooths out year-to-year volatility and allows apples-to-apples comparison of investments held for different lengths of time.
Does 10 years at 7% beat 20 years at 5%?
For a lump sum held for the same 20 years: $10,000 at 7% CAGR grows to $38,697; at 5% it reaches $26,533. The 7% investment wins if held for equal time. For only 10 years at 7%, the result is $19,672 — less than the 20-year 5% result of $26,533.
How do I calculate return if I made contributions over time?
Use IRR or XIRR in a spreadsheet. Each contribution has a different holding period, so simple total return understates or overstates performance. XIRR accounts for the timing of every cash flow to produce an accurate annualized return.
Disclaimer: This article is for educational purposes only and does not constitute investment advice. Past performance is not indicative of future results. Consult a registered financial advisor before making investment decisions.